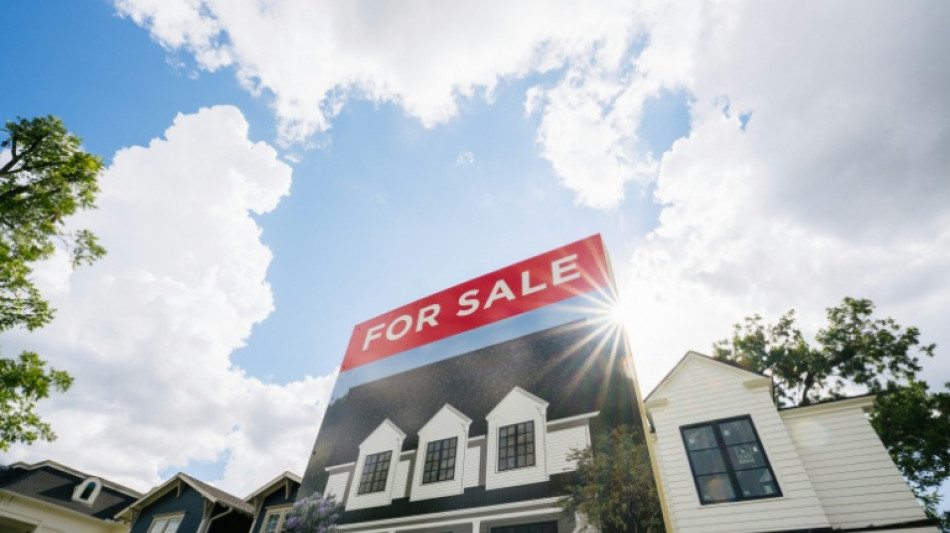
US existing home sales end banner year with slump
The US real estate market last year saw the most existing homes sold in 15 years, even as sales slumped in the final month of 2021, according to industry data released Thursday.
With low borrowing rates spurring homebuyers, 6.12 million pre-owned homes were sold last year, the most since 2006 and 8.5 percent more than in 2020, the National Association of Realtors (NAR) said.
But it hasn't been smooth sailing for the property market, which plays a major role in the US economy.
High demand has pushed prices higher, while shortages of key materials and workers exacerbated the shortage of homes for sale.
In December, NAR said home sales declined 4.6 percent compared to November, breaking a streak of three straight months of increases, and worse than analysts expected.
"December saw sales retreat, but the pull back was more a sign of supply constraints than an indication of a weakened demand for housing," NAR Chief Economist Lawrence Yun said in a statement, adding that sales for 2021 overall "finished strong."
The supply challenges are far from over, with the inventory of homes for sale hitting an all-time low in December of 910,000 units, 18 percent lower than in November and 14.2 percent below the final month of 2020. That was equivalent to 1.8 months supply at the current sales pace.
"Home builders have already made strides in 2022 to increase supply, but reversing gaps like the ones we've seen recently will take years to correct," Yun warned.
Prices continued their upward climb amid the shortage, hitting a median of $358,000 last month, a 15.8 percent increase for the year, and rising in all regions of the country, the report said.
Sales in the West and South saw the biggest declines, dropping of 6.8 percent and 6.3 percent, respectively, compared to November, while the Midwest and Northeast each dropped 1.3 percent.
Nancy Vanden Houten of Oxford Economics predicted home sales this year would "mostly trend sideways" as the Federal Reserve raises lending rates and the economy continues to recover from the Covid-19 pandemic.
"Resilient demand will underpin the housing market, but limited supply and declining affordability from both higher prices and rising mortgage rates will constrain the pace of sales," she wrote in an analysis.
R.Yeung--ThChM