The China Mail - So where does the oceans' plastic waste come from?

USD -
AED 3.672504
AFN 66.000368
ALL 81.708779
AMD 361.738976
ANG 1.790365
AOA 917.000367
ARS 1521.732048
AUD 1.44321
AWG 1.8025
AZN 1.70397
BAM 1.737022
BBD 2.009681
BDT 122.678627
BGN 1.683441
BHD 0.376127
BIF 3010.346818
BMD 1
BND 1.277055
BOB 11.988987
BRL 5.210804
BSD 0.997824
BTN 96.669479
BWP 13.794573
BYN 3.005462
BYR 19600
BZD 2.00675
CAD 1.42495
CDF 2310.000362
CHF 0.828362
CLF 0.025096
CLP 990.920396
CNY 6.70455
CNH 6.712104
COP 3308.76149
CRC 457.213908
CUC 1
CUP 23.946889
CVE 97.930636
CZK 21.719304
DJF 177.681069
DKK 6.642604
DOP 59.576358
DZD 133.728851
EGP 52.20214
ERN 15
ETB 162.975798
EUR 0.88815
FJD 2.24725
FKP 0.755904
GBP 0.755116
GEL 2.60504
GGP 0.755904
GHS 11.718993
GIP 0.755904
GMD 73.503851
GNF 8777.476797
GTQ 7.625561
GYD 208.721524
HKD 7.847404
HNL 26.788934
HRK 6.696704
HTG 130.662996
HUF 327.440388
IDR 17888.5
ILS 3.05233
IMP 0.755904
INR 96.325504
IQD 1307.16284
IRR 1746539.503816
ISK 121.930386
JEP 0.755904
JMD 157.964386
JOD 0.70904
JPY 157.840385
KES 129.517297
KGS 87.450384
KHR 4047.24899
KMF 438.00035
KPW 900.000318
KRW 1343.510383
KWD 0.30883
KYD 0.831476
KZT 448.314756
LAK 22413.073405
LBP 89353.168436
LKR 329.979129
LRD 170.620365
LSL 16.683601
LTL 2.95274
LVL 0.60489
LYD 6.390159
MAD 9.913406
MDL 17.831165
MGA 4408.721524
MKD 54.687153
MMK 2099.554486
MNT 3597.321137
MOP 8.065101
MRU 39.872996
MUR 48.150378
MVR 15.460378
MWK 1730.183401
MXN 18.160804
MYR 4.084904
MZN 63.903729
NAD 16.683601
NGN 1330.790377
NIO 36.715662
NOK 9.618604
NPR 154.671167
NZD 1.780469
OMR 0.383712
PAB 0.997824
PEN 3.457791
PGK 4.518851
PHP 62.583504
PKR 276.36618
PLN 3.89575
PYG 5837.737022
QAR 3.637106
RON 4.741904
RSD 104.338559
RUB 83.633376
RWF 1477.774324
SAR 3.74329
SBD 8.078071
SCR 13.73871
SDG 601.503676
SEK 10.040104
SGD 1.278604
SHP 0.75503
SLE 24.603667
SLL 20969.491881
SOS 570.273991
SRD 37.811504
STD 20697.981008
STN 21.759403
SVC 8.730405
SYP 13002.000254
SZL 16.680137
THB 33.503646
TJS 9.184777
TMT 3.5
TND 2.973311
TOP 2.40776
TRY 49.127504
TTD 6.765842
TWD 31.821804
TZS 2629.246414
UAH 44.897287
UGX 3981.526711
UYU 40.21493
UZS 11768.728629
VES 865.47815
VND 25985.5
VUV 119.833605
WST 2.788681
XAF 582.588484
XAG 0.016565
XAU 0.000241497186
XCD 2.70255
XCG 1.798304
XDR 0.707052
XOF 582.588484
XPF 105.919446
YER 236.303589
ZAR 16.65505
ZMK 9001.203584
ZMW 19.606554
ZWL 321.999592
SSP 5712.591584
MXV 2.054862
  • RYCEF

    0.4000

    19.71

    +2.03%

  • CMSC

    0.0000

    20.4

    0%

  • BTI

    0.4200

    56.05

    +0.75%

  • BP

    0.2800

    44.43

    +0.63%

  • RBGPF

    1.6000

    67

    +2.39%

  • RIO

    -0.1500

    94.41

    -0.16%

  • AZN

    -0.4300

    166.15

    -0.26%

  • GSK

    0.4600

    49.7

    +0.93%

  • BCE

    -0.4100

    20.56

    -1.99%

  • NGG

    -0.2500

    75.24

    -0.33%

  • VOD

    -0.0400

    16.58

    -0.24%

  • RELX

    -0.4500

    33.07

    -1.36%

  • BCC

    -0.5500

    76.59

    -0.72%

  • CMSD

    -0.0300

    20.27

    -0.15%

  • JRI

    -0.2500

    10.77

    -2.32%

So where does the oceans' plastic waste come from?
So where does the oceans' plastic waste come from? / Photo: © AFP

So where does the oceans' plastic waste come from?

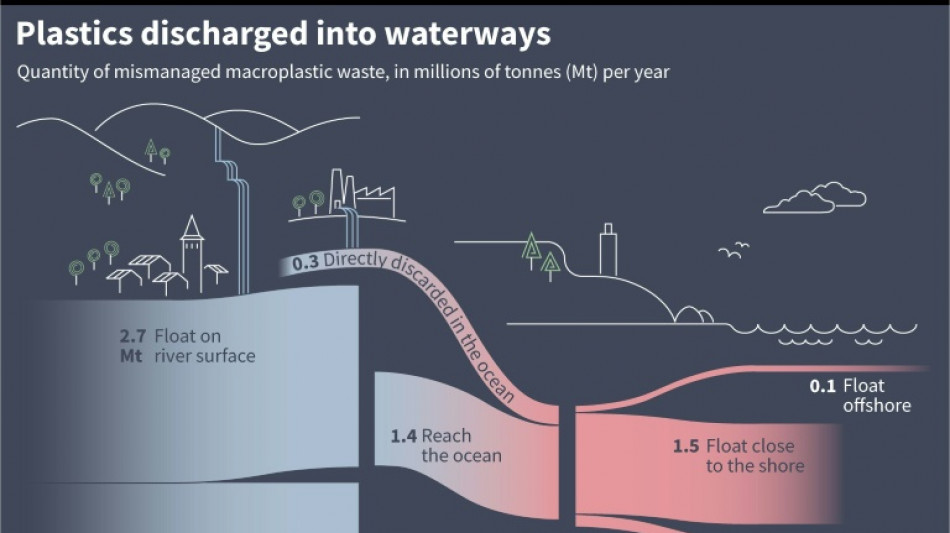
In the form of bottles, tyres, packaging and piping, millions of tonnes of plastic waste are dumped every year in the world's waterways, often ending up in the oceans.

Text size:

And their amount could almost double by 2060, unless strong measures are taken against the pollution, the Organisation for Economic Cooperation and Development (OECD) warns.

Due to mass production of the material from the 1950s to 2019, 140 million tonnes have already accumulated in the rivers, lakes and oceans, the OECD said in a 2023 report.

Some 22 percent of this forms a "plastic soup" in the oceans and 78 percent is found in freshwater ecosystems.

- Poor waste management -

Plastic burned in open pits or tossed in uncontrolled or unauthorised dumpsites is the main source of pollution of the aquatic environment.

Most of this plastic waste ends up in freshwaters, with a large part, including bottles and plastic used in the construction sector, sinking in waterways and lakes.

The rest, including food packaging and closed bottles, floats for "years, even decades", before ending up in the oceans, the OECD says.

Waste from shipping activity, including nets and fishing gear, is to a much lesser extent another source of plastic waste in the oceans, as well as so-called microplastics, pieces of plastic which measure less than five millimetres.

So called macroplastic, which is bigger than five millimetres, has an average life cycle of six months to 35 years and slowly decomposes to become microplastic, which is "more likely to be ingested by aquatic species", the OECD says.

- Asia's rivers -

The risk of plastic moving from land to the waterways, and then into the sea, differs from location to location.

Out of some 100,000 waterways, only 1,000 are responsible for four-fifths of the macroplastic waste in the oceans, according to a 2021 study by researchers for NGO Ocean Cleanup published in the Science Advances journal.

The remaining fifth comes from 30,000 other rivers.

Out of the 50 main rivers carrying plastic to the oceans, including small urban waterways, 44 are in Asia, "due to population density and bad waste management", Laurent Lebreton, Ocean Cleanup's director of research, told AFP.

The Philippines, which has thousands of islands, dumps the most plastic into the sea. Its Pasig River, which flows into Manila Bay, is "the most (plastic) polluted" in the world.

With the Philippines' Tullahan and Meycauayan Rivers, India's Ulhas River and Malaysia's Klang River, it is one of the top five carrying plastic into the oceans.

- Gloomy forecast -

Driven by rising population and economic growth, the global use of plastics should almost triple between 2019 and 2060, to 1,231 million tonnes (Mt) per year, according to the OECD.

That is a gloomy outlook for the aquatic environment where 493 Mt of plastic could pile up by 2060, of which more than half from sub-Saharan Africa, China, India, and other developing Asian countries, it says.

In Europe and the United States, on the contrary, plastic industrial waste in the aquatic environment should decrease, due to improved waste management, the OECD forecasts.

V.Fan--ThChM