
Silver X Reports Q3 2024 Financial Results
(All dollar amounts expressed in US dollars unless otherwise noted)
("Silver X" or the "Company") is pleased to report its financial results for the three and nine months ended September 30, 2024 for the Nueva Recuperada Project (the "Project") in Central Peru.
Q3 2024 Financial Highlights
Revenues of $5.0 million (3Q24) vs. $2.1 million (3Q23), an increase of $2.9 million.
Significant EBITDA improvement: Adjusted EBITDA of negative $0.1M (3Q24) vs. Adjusted EBITDA of negative $1.0M (3Q23).
Cash costs of $21.5 per AgEq ounce produced and AISC of $26.2 per AgEq ounce produced, reflective of the sustaining capital expenditure invested in the development of the Tangana mining unit ($1.0 million adding $3.9 per AgEq ounce produced to the AISC). (1)(2)
Cash cost per tonne was $100 in 3Q24 compared to $148 per tonne in 3Q23, a reduction of 32.3%.
Jose Garcia, Silver X Mining's CEO, commented: "I am pleased to see our mine developing in the right way, accessing new ore-shoots, expanding the orebody both horizontally and at depth, and opening up the terrific potential of our Tangana veins. The team is making significant improvements at the operation and despite some of our challenges, we manage to compete with much larger operations. This is especially notable when comparing year-to-date results with the same period last year. We are convinced our performance will improve substantially in 2025."
Notes:
Cash costs per Silver Equivalent ounce (AgEq) ounce produced and All-In-Sustaining Cost (AISC) per AgEq ounce produced are non-IFRS financial ratios. These are based on non- IFRS financial measures that do not have any standardized meaning prescribed under IFRS, and therefore may not be comparable to other issuers. Please refer to the "Non-IFRS Measures" section of this news release for further information.
AgEq ounce produced was calculated using the average sales prices of each metal for each month, and revenues from concentrate sales does not consider metallurgical recoveries in the calculations as the metal recoveries are built into the sales amounts.
Summary of Selected Financial Results
The information provided below are excerpts from the Company's unaudited interim Financial Statements and Management's Discussion and Analysis ("MD&A"), which can be found on the Company's website at www.silverxmining.com/investor#report or on SEDAR+ at www.sedarplus.ca.

Note:
EBITDA, Adjusted EBITDA, and Adjusted EBITDA per share are non-IFRS ratios with no standardized meaning under IFRS, and therefore may not be comparable to similar measures presented by other issuers. For further information, including detailed reconciliations to the most directly comparable IFRS measures, see "Non-IFRS Measures" in this news release and the MD&A.
Three months ended September 30, 2024 vs. 2023
For the three months ended September 30, 2024, the Company recorded:
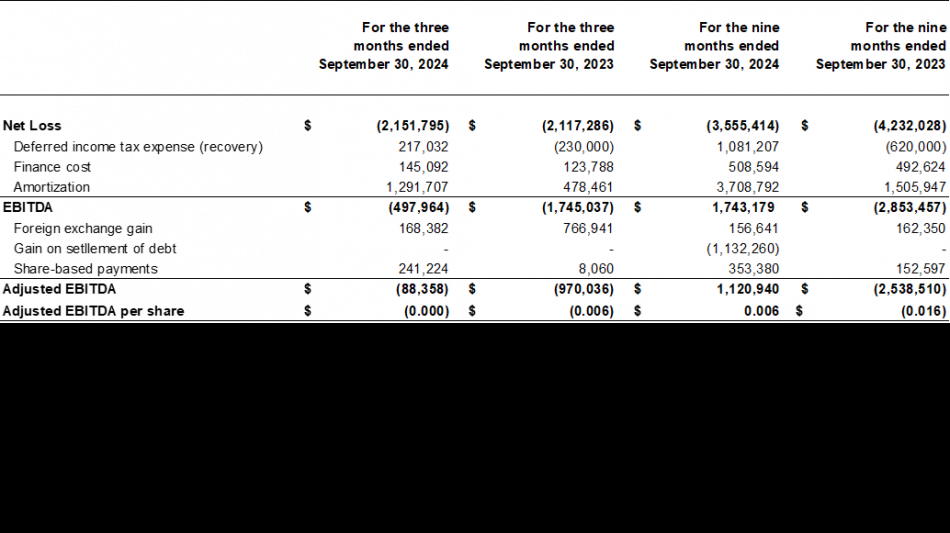
Net loss before tax of $1.9M, compared to a net loss before tax of $2.3M in the three months ended September 30, 2023.
EBITDA loss of $0.5M, compared to an EBITDA loss of $1.7M in the three months ended September 30, 2023.
Adjusted EBITDA loss of $0.09M, compared to an Adjusted EBITDA loss of $1.0M in the three months ended September 30, 2023.
The decrease in losses in the current period was primarily due to increased operating revenues from the sale of mineral production of $5.0M compared to $2.1M in the prior period (increase of $2.9M), decrease in foreign exchange losses of $0.2M compared to $0.8M in the same period last year (decrease of $0.5M), and partially offset with the increase in of cost of sales of $5.7M compared to $2.9M in the prior period (increase of $2.8M).
Nine months ended September 30, 2024 vs. 2023
For the nine months ended September 30, 2024, the Company recorded:
Net loss before tax of $2.5M, compared to a net loss before tax of $4.2M in the nine months ended September 30, 2023, a $1.7M improvement.
EBITDA income of $1.7M, compared to an EBITDA loss of $2.9M in the nine months ended September 30, 2023, a $4.6M improvement.
Adjusted EBITDA income of $1.1M, compared to an Adjusted EBITDA loss of $2.5M in the nine months ended September 30, 2023, a $3.6M improvement.
The increase in income in the current period was primarily due to increased operating revenues from the sale of mineral production of $16.0M compared to $11.3M in the prior period (increase of $4.7M), and gain on debt settlement of $1.1M compared to $Nil in the prior period, net with increase of cost of sales of $16.2M compared to $12.9M in the prior period (increase of $3.3M).
The following table reconciles the Net Loss to the EBITDA and Adjusted EBITDA:
Financial Position

The available cash during the period decreased by $0.2 million due to the outflow from the continuing development of the Tangana mine unit partially offset by the completed non-brokered private placement in April 2024.
Operational Results

Notes:
Average Realized Price, production cost per tonne processed, AgEq sold, cash cost per AgEq ounce produced and AISC per AgEq ounce produced are non-IFRS ratios with no standardized meaning under IFRS, and therefore may not be comparable to similar measures presented by other issuers. For further information, including detailed reconciliations to the most directly comparable IFRS measures, see "Non-IFRS Measures" in this news release and the MD&A.
AgEq ounces processed and produced were calculated based on all metals processed and produced using the average sales prices of each metal for each month during the period. Revenues from concentrate sales does not consider metallurgical recoveries in the calculations as the metal recoveries are built into the sales amounts.
Average realized price corresponds to the average prices for each metal on the following month after delivery, used to calculate the final value of the concentrate delivered in a given month before any deductions.
Non-IFRS Measures
The Company has included certain non-IFRS financial measures and ratios in this news release, as discussed below. The Company believes that these measures, in addition to measures prepared in accordance with IFRS, provide investors an improved ability to evaluate the underlying performance of the Company. The non-IFRS measures and ratios are intended to provide additional information and should not be considered in isolation or as a substitute for measures of performance prepared in accordance with IFRS. These financial measures and ratios do not have any standardized meaning prescribed under IFRS, and therefore may not be comparable to other issuers.
Cash Costs, All-In Sustaining Cost, EBITDA, and Adjusted EBITDA
The Company uses cash costs, cash cost per AgEq ounce produced, AISC, AISC per AgEq ounce produced, EBITDA and Adjusted EBITDA to manage and evaluate its operating performance in addition to IFRS measure because the Company believes that conventional measures of performance prepared in accordance with IFRS do not fully illustrate the ability of its operations to generate cash flows. The Company understands that certain investors use these measures to determine the Company's ability to generate earnings and cash flows for use in investing and other activities. Management and certain investors also use this information to evaluate the Company's performance relative to peers who present this measure on a similar basis.
Cash costs is calculated by starting with cost of sales, and then adding treatment and refining charges, and changes in depreciation and amortization.
Total cash production costs include cost of sales, changes in concentrate inventory, changes in amortization, less transportation and other selling costs and royalties. Cash costs per AgEq ounce produced is calculated by dividing cash costs by the AgEq ounces produced.
AISC and AISC per AgEq ounce produced are calculated based on guidance published by the World Gold Council (and used as a standard of the Silver Institute). The Company presents AISC on the basis of AgEq ounces produced. AISC is calculated by taking the cash costs and adding sustaining costs. Sustaining costs are defined as capital expenditures and other expenditures that are necessary to maintain current production. Management has exercised judgment in making this determination.
The following table reconciles cash costs, cash costs per AgEq ounce, AISC and AISC per AgEq ounce produced to cost of sales, the most directly comparable IFRS measure:
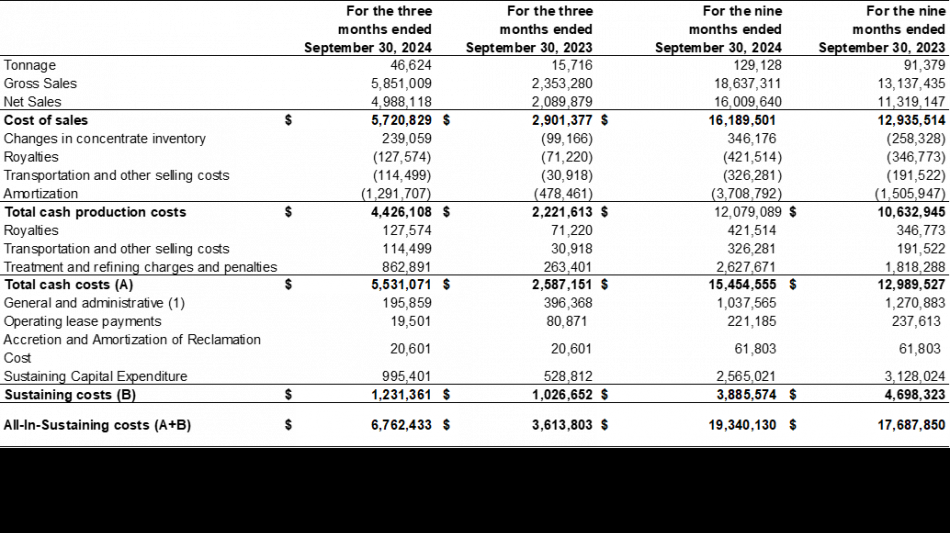
The following table shows the calculation of the cash costs and AISC per AgEq ounce produced:

To improve the accuracy and presentation of AISC calculations, Silver X refined the composition of General & Administrative Expense in sustaining cost, excluding discretionary costs for business development, investor relations and share-based compensation. For comparative purposes the prior period were also recalculated based on the revised methodology, resulting in AISC of $26.2 for the three months period ending September 30, 2024, compared to $37.9 for the same period in 2023 (30.7% decrease) and $23.0 for the nine months period ending September 30, 2024, compared to $28.2 for the same period in 2023 (18.4% decrease).
Production Cost Per Tonne Processed
A reconciliation between production cost per tonne (excluding amortization and changes in inventories) and the cost of sales is provided below. Changes in inventories are excluded from the calculation of Production Cost per Tonne Processed. Changes in inventories reflect the net cost of concentrate inventory (i) sold during the current period but produced in a previous period or (ii) produced but not sold in the current period. The Company uses Production Cost Per Tonne Processed to evaluate its operating performance in addition to IFRS measure because Company believes that conventional measures of performance prepared in accordance with IFRS do not fully illustrate the ability of its operations to generate cash flows. Management and certain investors also use this information to evaluate the Company's performance relative to peers who present this measure on a similar basis.

During the period, cash cost per tonne decreased with the increase of the level of tonnage of ore processed, amounting to 46,624 tonnes for 3Q24 compared to 15,716 tonnes for 3Q23. Overall operating efficiencies improved resulting in a lower production cash cost per tonne of $100 in 3Q24 compared to $148 per tonne in 3Q23, a reduction of 32.3%.
The capital expenditure deployed in the development of the Tangana mining unit during the period was the main cost contributor to AISC. Investment in sustainable CAPEX will enable the Company to access new production fronts and transition to higher head-grade areas.
Average Realized Price
Average realized price is a non-IFRS financial measure. The Company uses "average realized price per ounce of silver", "average realized price per ounce of gold", "average realized price per ounce of zinc" and "average realized price per ounce of lead" because it understands that in addition to conventional measures prepared in accordance with IFRS, certain investors and analysts use this information to evaluate the Company's performance as compared with "average market prices" of metals for the period.
Average realized metal prices represent the sale price of the metal. Average realized price corresponds to the average prices for each metal on the following month after delivery, used to calculate the final value of the concentrate delivered in a given month before any deductions:

Non-IFRS Measures
Cash costs ($ per Oz sold) and AISC ($ per Oz sold) are non-IFRS financial measures and non-IFRS ratios in this press release. These measures do not have any standardized meaning prescribed under IFRS, and therefore may not be comparable to other issuers. Please refer to the Non-IFRS Measures section of the Company's most recently filed Management's Discussion and Analysis which is available on SEDAR+ at www.sedarplus.ca for full details on these measures, which is incorporated by reference into this press release.
Please see "Cautionary Note regarding Production without Mineral Reserves" at the end of this news release.
Qualified Person
Mr. A. David Heyl, B.Sc., C.P.G who is a qualified person under NI 43-101, has reviewed and approved the technical content of this news release for Silver X. Heyl is a consultant for Silver X.
Cautionary Note regarding Production without Mineral Reserves
The decision to commence production at the Nueva Recuperada Project and the Company's ongoing mining operations as referenced herein (the "Production Decision and Operations") are based on economic models prepared by the Company in conjunction with management's knowledge of the property and the existing estimate of mineral resources on the property. The Production Decision and Operations are not based on a preliminary economic assessment, a pre-feasibility study or a feasibility study of mineral reserves demonstrating economic and technical viability. Accordingly, there is increased uncertainty and economic and technical risks of failure associated with the Production Decision and Operations, in particular: the risk that mineral grades will be lower than expected; the risk that additional construction or ongoing mining operations are more difficult or more expensive than expected; and production and economic variables may vary considerably, due to the absence of a detailed economic and technical analysis in accordance with NI 43-101.
About Silver X
Silver X is a rapidly expanding silver producer and developer. The Company owns the 20,472-hectare Nueva Recuperada Silver Project in Central Peru and produces silver, gold, lead and zinc from its Tangana Mining Unit. We are building a premier silver company that aims to deliver outstanding value to all stakeholders, consolidating and developing undervalued assets, adding resources, and increasing production while aspiring to sustain the communities that support us and stewarding the environment. Current production, paired with immediate development and brownfield expansion opportunities, presents investors with the opportunity to invest in the early stages of a silver producer with strong growth prospects. For more information visit our website at www.silverxmining.com.
ON BEHALF OF THE BOARD
José M. Garcia, CEO and Director
For further information, please contact:
Susan Xu
Investor Relations
[email protected]
+1 778 323 0959
Neither TSX Venture Exchange nor its Regulation Services Provider (as that term is defined in policies of the TSX Venture Exchange) accepts responsibility for the adequacy or accuracy of this release.
Cautionary Statement Regarding "Forward-Looking" Information
This press release contains forward-looking information within the meaning of applicable Canadian securities legislation ("forward-looking information"). Generally, forward-looking information can be identified by the use of forward-looking terminology such as "plans", "expects" or "does not expect", "is expected", "budget", "scheduled", "estimates", "forecasts", "intends", "anticipates" or "does not anticipate", or "believes", or variations of such words and phrases or state that certain acts, events or results "may", "could", "would", "might" or "will be taken", "occur" or "be achieved". All information contained in this press release, other than statements of current and historical fact, is forward-looking information. Forward-looking information contained in this press release may include, without limitation, exploration plans, results of operations, expected performance at the Project, the Company's belief that the Tangana system will provide considerable resource expansion potential, that the Company will be able to mine the Tangana Mining Unit in an economic manner, and the expected financial performance of the Company.
The following are some of the assumptions upon which forward-looking information is based: that general business and economic conditions will not change in a material adverse manner; demand for, and stable or improving price for the commodities we produce; receipt of regulatory and governmental approvals, permits and renewals in a timely manner; that the Company will not experience any material accident, labourdispute or failure of plant or equipment or other material disruption in the Company's operations at the Project and Nueva Recuperada Plant; the availability of financing for operations and development; the Company's ability to procure equipment and operating supplies in sufficient quantities and on a timely basis; that the estimates of the resources at the Project and the geological, operational and price assumptions on which these and the Company's operations are based are within reasonable bounds of accuracy (including with respect to size, grade and recovery); the Company's ability to attract and retain skilled personnel and directors; and the ability of management to execute strategic goals.
Forward-looking information is subject to known and unknown risks, uncertainties and other factors that may cause the actual results, level of activity, performance or achievements of the Company, as the case may be, to be materially different from those expressed or implied by such forward-looking information, including but not limited to those risks described in the Company's annual and interim MD&As and in its public documents filed on www.sedarplus.ca from time to time. Forward-looking statements are based on the opinions and estimates of management as of the date such statements are made. Although the Company has attempted to identify important factors that could cause actual results to differ materially from those contained in forward-looking information, there may be other factors that cause results not to be as anticipated, estimated or intended. There can be no assurance that such information will prove to be accurate, as actual results and future events could differ materially from those anticipated in such statements. Accordingly, readers should not place undue reliance on forward-looking information. The Company does not undertake to update any forward-looking information, except in accordance with applicable securities laws.
SOURCE: Silver X Mining Corp.
J.Thompson--ThChM